[오픈소스] APM 무료 툴 - glowroot
대부분 APM 툴로 제니퍼 or socuter 를 사용할 것이다.
우리 회사도 scouter 를 사용하여 모니터링 하고 있지만
다른 무료 툴을 찾다가 설치가 간편한 툴을 발견하여 소개한다.
socuter 는 client 툴을 별도로 설치하여
중앙에서 관리하는 반면, 이 툴은 개별적으로 서버에 올리고
해당 서버로 접속하여서 보는 방식이다. (웹 브라우저 기반)
공식 사이트 - https://glowroot.org/메인 페이지에 링크된 zip 파일을 다운 받는다.
모니터링 하려는 서버에 해당 파일을 올리고 압축을 해제한다.
[root@xdoc-centralm1 /tmp]# ll
합계 18152
-rw-r--r-- 1 hs20151191 wheel 18566598 2020-11-05 15:21 glowroot-0.13.6-dist.zip
-rw-rw-r-- 1 root       root       119 2020-11-05 16:04 hp_battery.txt
-rw-rw-r-- 1 root       root      1280 2020-11-05 16:04 hp_detail.txt
-rw-rw-r-- 1 root       root      1427 2020-11-05 16:04 hp_status.txt
drwxr-xr-x 2 root       root      4096 2020-11-05 16:08 hsperfdata_root
-rw-rw-r-- 1 root       root         8 2020-11-05 16:04 limitrun-root
srwxrwxrwx 1 mysql      mysql        0 2020-05-21 01:10 mysql.sock
[root@xdoc-centralm1 /tmp]# unzip glowroot-0.13.6-dist.zip
Archive:  glowroot-0.13.6-dist.zip
   creating: glowroot/
   creating: glowroot/lib/
  inflating: glowroot/glowroot.jar
  inflating: glowroot/LICENSE
  inflating: glowroot/NOTICE
  inflating: glowroot/lib/glowroot-embedded-collector.jar
  inflating: glowroot/lib/glowroot-central-collector-https-linux.jar
  inflating: glowroot/lib/glowroot-central-collector-https-linux-alpine.jar
  inflating: glowroot/lib/glowroot-central-collector-https-windows.jar
  inflating: glowroot/lib/glowroot-central-collector-https-osx.jar
  inflating: glowroot/lib/glowroot-logging-logstash.jar
[root@xdoc-centralm1 /tmp]# cd glowroot
[root@xdoc-centralm1 /tmp/glowroot]# ll
합계 10488
-rw-r--r-- 1 root root    71666 2019-04-25 08:24 LICENSE
-rw-r--r-- 1 root root     4906 2019-04-25 08:24 NOTICE
-rw-r--r-- 1 root root 10652564 2020-02-29 17:26 glowroot.jar
drwxr-xr-x 2 root root     4096 2020-02-29 17:26 lib
압축을 해제하면 위와 같이 파일이 생기는 것을 볼 수 있다.
그리고 모니터링 하려는 was (여기서는 tomcat) 의 JAVA_OPTS 부분에 1줄을 추가한다.
JAVA_OPTS="-Xms30720M -Xmx30720M \
.....
-javaagent:/app/alfresco/tomcat/glowroot/glowroot.jar \  # 압축을 푼 경로
...."
그리고 was 를 재구동하면... 4000 번 포트가 활성화 된 것을 알 수 있다. (잉 근데 127.0.0.1 로 바인딩 되어 있음)
다시, 원래 압축 푼 경로를 보면
[root@xdoc-centralm1 /app/alfresco/tomcat/glowroot]# ll
합계 10512
-rw-r--r-- 1 root root    71666 2019-04-25 08:24 LICENSE
-rw-r--r-- 1 root root     4906 2019-04-25 08:24 NOTICE
-rw-r--r-- 1 root root      812 2020-11-05 16:07 admin.json  // 새로 생김
-rw-r--r-- 1 root root     4399 2020-11-05 16:05 config.json
drwxr-xr-x 2 root root     4096 2020-11-05 16:08 data
-rw-r--r-- 1 root root 10652564 2020-02-29 17:26 glowroot.jar
drwxr-xr-x 2 root root     4096 2020-02-29 17:26 lib
drwxr-xr-x 2 root root     4096 2020-11-05 16:05 logs
drwxr-xr-x 2 root root     4096 2020-11-05 16:08 tmp
몇 개의 파일들이 생성된 것을 확인 할 수 있다.
여기서 admin.json 파일의 127.0.0.1 부분을 자신의 IP 나 0.0.0.0 으로 수정하고 다시 재구동하면 된다 ㅜㅜ


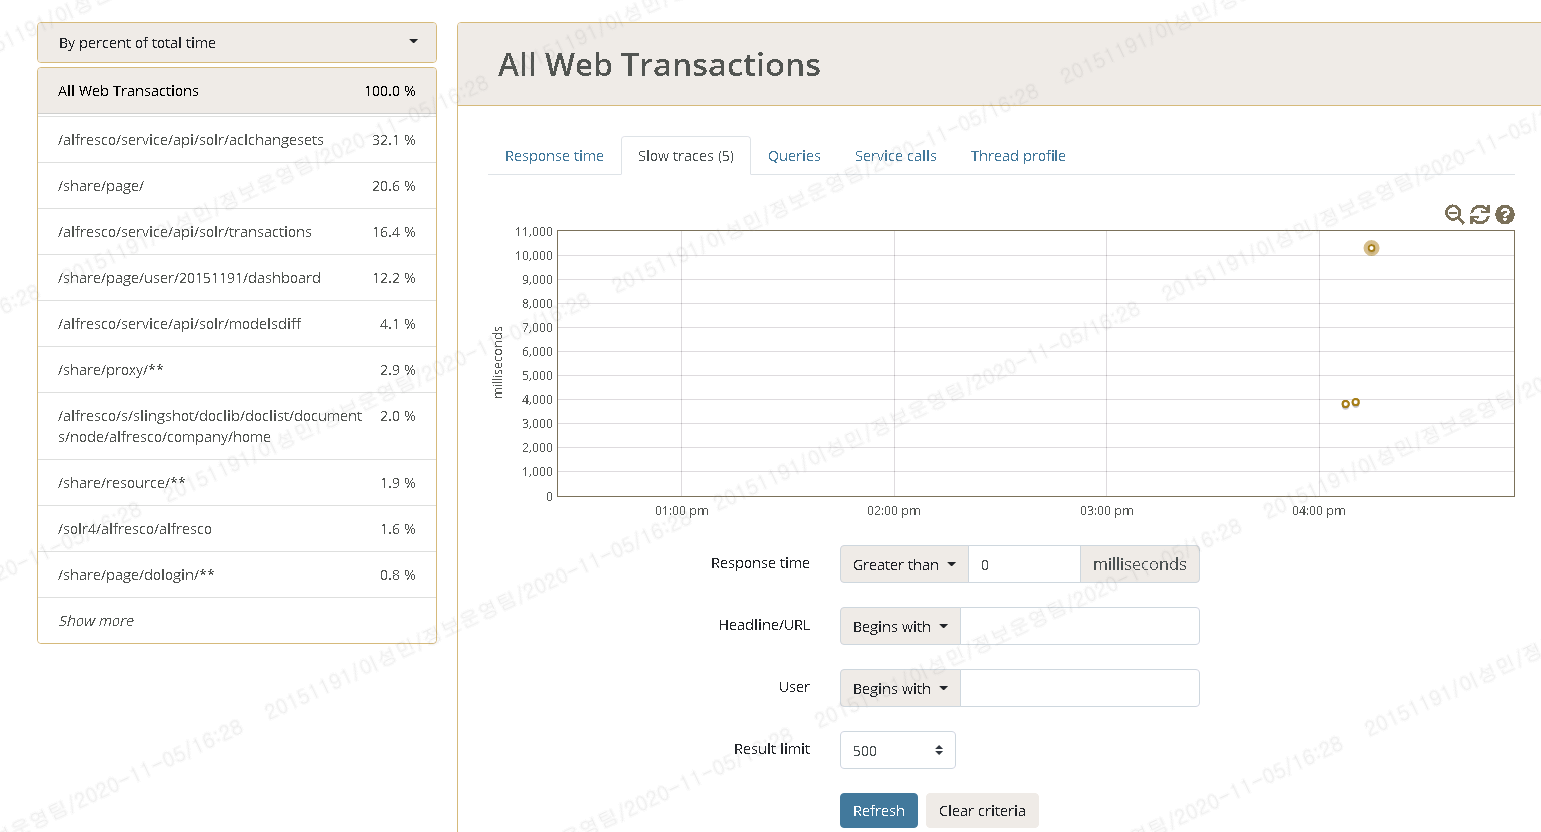
위에 보면 강제로 gc 를 발생하는 기능이 있던데, 클릭해 보니 young gc count 가 올라가는 것으로 보인다.
아무래도 중앙 서버에 접속해 보는 것이 아니기 때문에, 서버 여러대를 볼 때에는 socuter 가 더 좋을 것 같고
1, 2 대 모니터링 할 때 간편하게 사용하면 좋을 것 같다.
'OpenSource' 카테고리의 다른 글
| [오픈소스] graylog 설치/설정 (centos) (0) | 2019.12.06 |
|---|---|
| [오픈소스] gitlab 설치 centos6 (0) | 2019.10.30 |
| [오픈소스] GOCD (Continuous Delivery) 배포(CI/CD) 툴 (0) | 2019.10.10 |
| [오픈소스] 구글시트와 유사한 웹기반 오피스, onlyoffice (0) | 2019.04.04 |
| [오픈소스] GLPI 자산관리 솔루션 (0) | 2019.01.24 |
